Project Management in the Chemical Industry.
Process Flow Diagram
Process Flow Diagram
Process flow diagrams carry more information than the block flow diagrams from which they are derived.
They show more detailing about major equipment and subsystems and the flow of products between them.
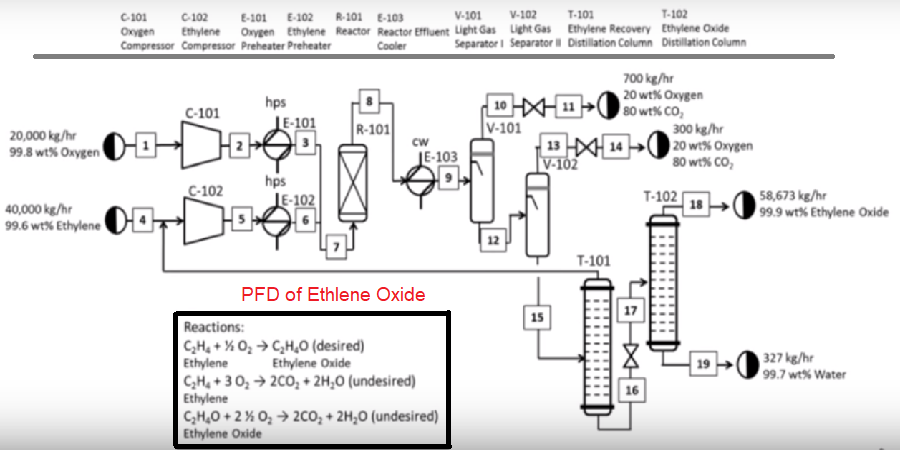
Process Flow Diagram (PFD) is a commonly used chart developed after BFD in chemical process engineering.
PFD shows detailed mass/energy balance data along with stream composition and physical properties at the bottom of the diagram.
Process flow diagrams use special shapes to represent different types of equipment involved in the process. , such as valves, electrical, instruments and piping flow. For rotating equipments, PFDs carry important information, such as pump capacities and pressure heads, etc. for Static Equipments such as vessels, tanks, vessels, columns, exchangers, etc operating pressures and temperatures are often shown for clarity.
A typical PFD shows the following items:
Process flow direction.
Process Piping.
Major bypass and recirculation lines.
Control and process-critical valves.
Processes identified by system name.
System rating and operational values.
Composition of fluids.